LevelView by Grimm Audio

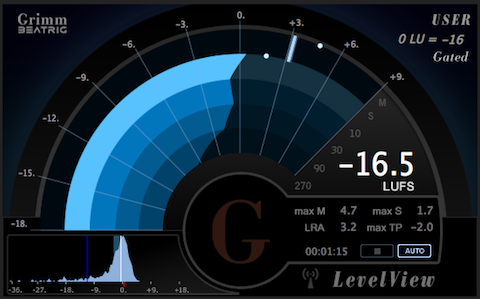
LevelView by Grimm Audio is a highly functional and well designed real time Loudness Meter.

Here are the details:

LevelView features a unique multifaceted Rainbow Meter. Clicking the Rainbow display toggles the Meter scale (EBU +9 or EBU +18).

There are three compliance modes: EBU R128, ATSC A/85, and a custom User specification (Gated or Ungated). The Rainbow Meter displays a Relative Scale. Consequentially the defined target will be equivalent to 0 LU.

The upper blue Rainbow arc represents Short Term Loudness measured within a 3 sec. time frame. The inward blue arcs indicate slower time frame variances (10, 30, 90, and 270 seconds).

The arced needle meter located above the Rainbow Meter represents the Momentary Loudness measured within a 400ms time frame.

Visual dots displayed (and held) on both the Momentary and Short Term Loudness indictor plots represent the maximum values for each descriptor. Both indicators will shift to orange when their values exceed recognized guidelines (+8 max M, and +6 Max S).

The numerical descriptor table features a large Integrated Loudness value. This may display an Absolute Scale value in LUFS, or a Relative Scale value in LU’s. Clicking the descriptor text toggles it’s view.

Additional numerical descriptors include maximum Momentary Loudness (max M), maximum Short Term Loudness (max S), LRA (Loudness Range), PLR (Peak to Loudness Ratio), and maximum True Peak (max TP). Clicking the max TP descriptor text will toggle the measurement algorithm and display max TP or max SP (Sample Peak). Descriptors will shift to orange when a displayed value exceeds recognized or specification guidelines.

The graph located at the lower left is the Loudness Range histogram. It displays the distribution of the measured Loudness over time. The data will indicate whether further dynamic range compression may be necessary.

LevelView supports Manual start and stop measurements. Setting the meter to Auto will force it to follow the host DAW’s transport. In essence the meter will automatically start/stop and reset based on the status of the transport.

Link mode records and stores data continuously. This allows the operator to revert back in time and re-measure a passage without resetting the stored measurements. In the event a passage is skipped, a gap warning will appear in orange. Re-measurement of a skipped segment will clear the gap warning. The Stop button resets the memory. Note the LevelView documentation indicates that the host “must provide time code for the Link function to work.”

It is possible to run various connected (Host and Client) instances of LevelView on a network or over the Internet. I will be testing these options in the near future.

LevelView is available as an AU, VST, or AAX Plugin. The AU and VST versions support (5.1) Surround Sound measurement. The meter conforms to the SMPTE/ITU channel matrix standard (L-R-C-LFE-Ls-Rs).

The meter may also run in a stand-alone mode with no DAW dependency. I/O configuration options are provided.

My Assessment:

I like this meter and I appreciate it’s unique design and accuracy. The networking options, support for Surround Sound, and stand-alone capability make it highly flexible and well worth it’s reasonable cost ($70 U.S. at Don’tCrack). I’m happy to recommend it.

Improvements I’d like to see:

– Scaleable UI
– Option to define a custom Maximum True Peak in the User mode (currently it defaults to -1.0 dBTP)

-paul.
Loudness Meter Scale Variations

I thought I’d revisit various aspects of Loudness Meter Absolute/Relative Scale correlation, and provide a visual representation of a real time processing Session with both Scales active.

Descriptors and Scales

Modern Loudness Meters display various descriptors including Program Loudness – also referred to as Integrated Loudness. There are two scales that can be used to display measured Program or Integrated Loudness over time …

The most common is an Absolute Scale, displayed in LUFS or LKFS. LUFS refers to Loudness Units relative to Full Scale. LKFS refers to Loudness Units K-Weighted relative to Full Scale. There is no difference in the perceptual measured loudness between both descriptor references.

It is also possible to measure and display Integrated/Program Loudness as Loudness Units (or LU’s) on a Relative Scale where 1LU == 1 dB.

When shifting to a Relative Scale, the 0 LU increment is always equivalent to the Meter’s user defined or spec. defined Absolute Loudness target.

For example, in an R128 -23.0 LUFS Absolute Scale workflow, setting the Meter to display a Relative Scale changes the target to 0 LU.

So – if a piece of measured audio checks in at -23.0 LUFS on an Absolute Scale, it would be perceptually equal to measured audio checking in at 0 LU on a Relative Scale.

Likewise if the Meter’s Absolute Scale target is set to -16.0 LUFS, it will correlate to 0 LU on a Relative Scale. Again both would reflect perceptual equivalence.

All broadcast delivery specifications suggest Absolute Scale Integrated Loudness targets. However, for any number of subjective reasons – many operators prefer to use the alternative Relative Scale and “mix or master to 0 LU.”

Please note Loudness Units are also the proper way in which to describe Loudness differentials between two programs. For instance, “Program (A) is +2 LU louder than Program (B).” One might also describe gain offsets in LU’s as opposed to dB’s.

LU Meter

Hornet Plugins recently released Hornet LU Meter. This tool is a Loudness Meter plugin designed to measure and display Integrated/Program Loudness within a 400ms time window. This measurement represents the Momentary Loudness descriptor.

The Meter is indeed nifty and affordable. However there is one sort of caveat worth noting: As the name suggests, it is an LU Meter. In essence Integrated (Momentary) Loudness measurements are solely displayed on a Relative Scale.

Session

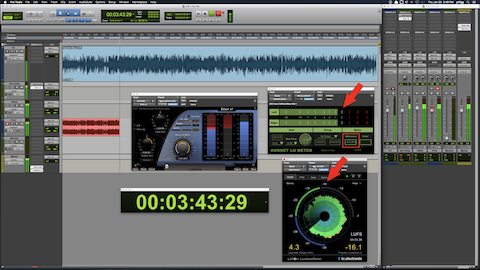
The displayed Session (image) consists of a single mono VO clip. The objective is to print a processed stereo version in RT checking in at -16.0 LUFS with a maximum True Peak no higher than -2.0 dBTP.

The output of the mono VO track is routed to a mono Auxiliary Input track titled Normalize. If you are not familiar with Pro Tools, an Auxiliary Input track is not the same as an Auxiliary Send. Auxiliary Input tracks allow the user to pass signal using buses, insert plugins, and adjust level. They are commonly used to create sub-mixes.

I’ve inserted a Compressor and a Limiter on the Normalize Auxiliary Input track. The processed audio is passing through at -19.0 LUFS (mono).

The audio is then routed to a second (now stereo) Auxiliary Input track titled Offset. I use the track fader to apply a +3 dB gain offset, This will reconstitute the loss of gain that occurs on center panned mono tracks. The attenuation is a direct result of the Pro Tools Pan Depth setting.

The signal flow/output is now passing -16.0 LUFS audio. It is routed to a standard audio track titled Print. When this track is armed to record, it is possible to initiate a realtime bounce of the processed/routed audio.

The Meters

Notice the instances of the Hornet LU Meter and TC Electronics Loudness Radar. Both Meters are inserted on the Master Bus and are measuring the session’s Master Output.

I set the Reference (target) on the Hornet LU Meter to -16.0 LUFS. In essence 0 LU on it’s Relative Scale represents -16.0 LUFS.

Conversely the TC Electronic Meter is configured to display Absolute Scale measurements. The circular LED that borders the Radar area indicates Momentary Loudness. The defined Integrated Loudness target is displayed under the arrow at the 12 o’clock position.

Remember the Hornet LU Meter solely displays Momentary Loudness. If you compare it’s current reading to the indication of Momentary Loudness on the TC Electronic Meter, the relationship between Relative Scale and Absolute Scale measurement is clearly indicated. Basically the Hornet Meter registers just below 0 LU. The TC Electronic Meter registers just below -16.0 LUFS.

I will say if you are comfortable monitoring real time Momentary Loudness and understand Relative/Absolute Scale correlation, the Hornet tool is quite useful. In fact it contains additional features such as Grouping, auto/manual Gain Compensation, and auto-Maximum Peak protection.

Additional insight on the K-weighting Curve or K-weighted filtering:

K-weighting suggests de-emphasized low frequencies by way of a high-pass filter. A high-shelving filter is applied to the upper frequency range, and the measured data is averaged.

TC Electronic describes applied K-weighting on audio channels as a “method to build a bridge between subjective impression and objective measurement.”

-paul.

Loudness Measurement and Silence

Consider this: Two extended segments of audio, Loudness Normalized (or mixed in real time) to the same Integrated Loudness Target.

Segment (A) is fairly consistent, with a very limited amount of intermittent silence gaps.

Segment (B) is far less consistent, due to a multitude of intermittent silence gaps.

When passing both segments through a Loudness Meter (or measuring the segments offline), and recognizing Integrated Loudness is a reflection of the average perceptual Loudness of an entire segment – how will inherent silence affect the accuracy of the cumulative measurements?

In theory the silence gaps in Segment (B) should affect the overall measurement by returning a lower representation of average Integrated Loudness. If additional gain is added to compensate, Segment (B) would be perceptually louder than Segment (A).

Basically without some sort of active measurement threshold, the algorithms would factor in silence gaps and return an inaccurate representation of Integrated Loudness.

The Fix

In order to establish perceptual accuracy, silence gaps must be removed from active measurements. Loudness Meters and their algorithms are designed to ignore silence gaps. The omission of silence is based on the relationship between the average signal level and a predefined threshold.

Loudness Meter (G10) Gate

The specification Gate (G10) is an aspect of the ITU Loudness Measurement algorithms included in compliant Loudness Meters. It’s function is to temporarily pause Loudness measurements when the signal drops below a relative threshold, thus allowing only prominent foreground sound to be measured.

The relative threshold is -10 LU below ungated LUFS. Momentary and Short Term measurements are not gated. There is also a -70 LUFS Absolute Gate that will force metering to ignore extreme low level noise.

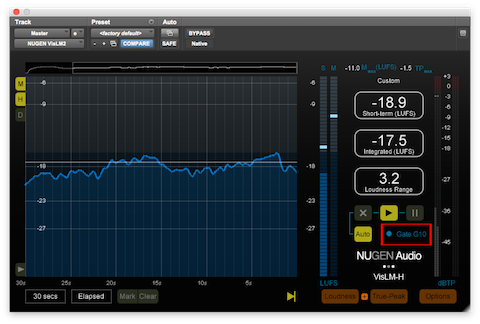
Most Loudness Meters reveal a visual indication of active gating (see attached image) and confirm the accuracy of displayed measurements.

Gate-(480)

Additional “Gate” Generalizations and Nomenclature

A Downward Expander and it’s applied attenuation is dependent on signal level when the signal drops below a user defined threshold. The Ratio dictates the amount of attenuation. Alternatively a Noise Gate functions independent of signal level. When the level drops below the defined threshold, hard muting is applied.

Silence Gate

This is a somewhat proprietary term. It is a parameter setting available on the Aphex 320A and 320D Compellor hardware Leveler/Compressor.

Compellor

When a passing signal level drops below the user defined Silence Gate threshold for 1 second or longer, the device’s VCA (Voltage Controlled Amplifier) gain is frozen. The Silence Gate will prevent the Leveling and Compression processing from releasing and inadvertently increasing the audibility of background noise.

-paul.

Loudness Meter Descriptors …

In the recent article published on Current.org “Working Group Nears Standard for Audio Levels in PRSS Content”, the author states:

“Working group members believe that one solution may lie in promoting the use of Loudness Meters, which offer more precision by measuring audio levels numerically. Most shows are now mixed using peak meters, which are less exact.”

Peak Meters are exact – when they are used to display what they are designed to measure:Sample Peak Amplitude. They do not display an accurate representation of average, perceived loudness over time. They should only be used to monitor and ultimately prevent overload (clipping).

It’s great that the people in Public Radio are finally addressing distribution Loudness consistency and compliance. My hope is their initiative will carry over into their podcast distribution models. In my view before any success is achieved, a full understanding of all spec. descriptors and targets would be essential. I’m referring to Program (Integrated) Loudness, Short Term Loudness, Momentary Loudness, Loudness Range, and True Peak.

Loudness Meter

A Loudness Meter will display all delivery specification descriptors numerically and graphically. Meter descriptors will update in real time as audio passes through the meter.

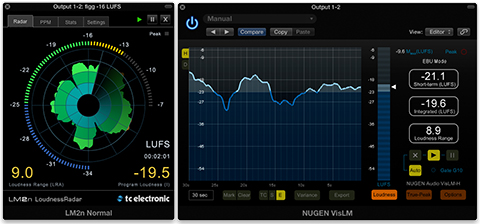
Short Term Loudness values are often displayed from a graphical perspective as designed by the developer. For example TC Electronic’s set of meters (with the exception of the LM1n) display Short Term Loudness on a circular graph referred to as Radar. Nugen Audio’s VisLM meter displays Short Term Loudness on a grid based histogram. Both versions can be customized to suit your needs and work equally well.

meters-480

Loudness Meters also include True Peak Meters that display any occurrences of Intersample Peaks.

Descriptors

All Loudness standardization guidelines specify a Program Loudness or “Integrated Loudness” target. This time scaled descriptor indicates the average, perceived loudness of an entire segment or program from start to finish. It is displayed on an Absolute scale in LUFS (Loudness Units relative to Full Scale), or LKFS (Loudness Units K Weighted relative to Full Scale). Both are basically the same. LUFS is utilized in the EBU R128 spec. and LKFS is utilized in the ATSC A/85 spec. What is important is that a Loudness Meter can display Program Loudness in either LUFS or LKFS.

The Short Term Loudness (S) descriptor is measured within a time window of 3 seconds, and the Momentary Loudness (M) descriptor is measured within a time window of 400 ms.

The Loudness Range (LRA) descriptor can be associated with dynamic range and/or loudness distribution. It is the difference between average soft and average loud parts of an audio segment or program. This useful indicator can help operators decide whether dynamic range compression is necessary.

Gating

The specification Gate (G10) function temporarily pauses loudness measurements when the signal drops below a relative threshold, thus allowing only prominent foreground sound to be measured. The relative threshold is -10 LU below ungated LUFS. Momentary and Short Term measurements are not gated. There is also a -70 LUFS Absolute Gate that will force metering to ignore extreme low level noise.

Absolute vs. Relative

I mentioned that LUFS and LKFS are displayed on an Absolute scale. For example the EBU R128 Program Loudness target is -23.0 LUFS. For Podcast/Internet/Mobile the Program Loudness target is -16.0 LUFS.

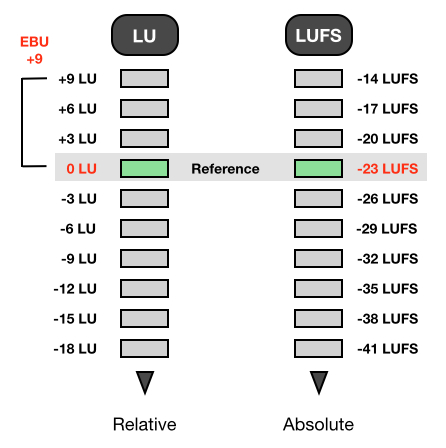
There is also a Relative scale that displays LU’s, or Loudness Units. A Relative LU scale corresponds to an Absolute LUFS/LKFS scale, where 0 LU would equal the specified Absolute target. In practice, -23 LUFS in EBU R128 is equal to 0 LU. For Podcast/Mobile -16.0 LUFS would also be equal to 0 LU. Note that the operator would need to set the proper Program Loudness target in the Meter’s Preferences in order to conform.

ab-rel

LU and dB Relationship

1 LU is equal to 1 dB. So for example you may have measured two programs: Program A checks in at -20 LUFS. Program B checks in at -15 LUFS. In this case program B is +5 LU louder than Program A.

Placement

Loudness Meter plugins mainly support online (Real Time) measurement of an audio signal. For an accurate measurement of Program Loudness of a clip or mixed segment the meter must be inserted in the DAW at the very end of a processing chain, preferably on the Master channel. If the inserts on the Master channel are post fader, any change in level using the Master Fader will result in a global gain offset to the entire mix. The meter would then (over time) display the altered Program Loudness.

If your DAW’s Master channel has pre fader inserts, the Loudness Meter should still be inserted on the Master Channel. However the operator would first need to route the mix through a Bus and use the Bus channel fader to apply global gain offset. The mix would then be routed to the Master channel where the Loudness Meter is inserted.

If your DAW totally lacks inserts on the Master channel, Buses would need to be used accordingly. Setup and routing would depend on whether the buses are pre or post fader.

Some Loudness Meter plugins are capable of performing offline measurements in certain DAW’s on selected regions and/or clips. In Pro Tools this would be an Audio Suite process. You can also accomplish this in Logic Pro X by initiating and completing an offline bounce through a Loudness Meter.

-paul.

Waves WLM Plus Loudness Meter …

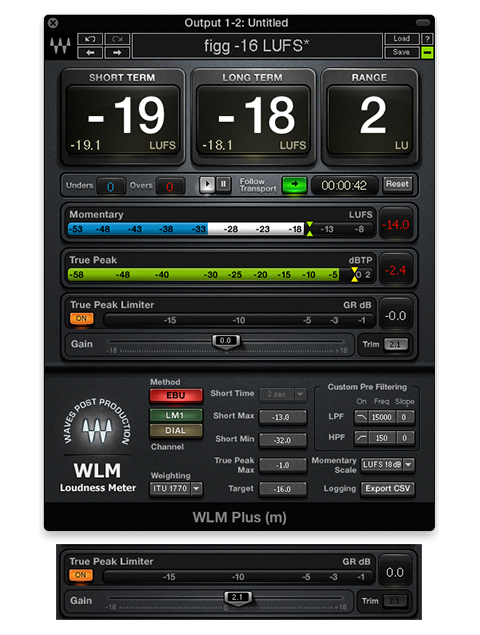
Waves has just released a stellar update to their critically acclaimed WLM Loudness Meter. The new WLM Plus version, available for free to those who are eligible – includes a few new and very useful features.

The plugin now acts as both a Loudness Meter and a Loudness Processor. New controls (Gain/Trim) are located in the Processing Panel and are designed to apply loudness normalization and correction. There is also a new switchable True Peak Limiter that adheres to the True Peak parameter defined in the selected running preset.

Here’s how it works:

Notice below I am running WLM Plus using my own custom preset (figg -16 LUFS). Besides the obvious Integrated Loudness target (-16 LUFS), I’ve defined -1.0 dBTP as my True Peak ceiling.

wlm-blog

What you need to do is insert the plugin at the end of your chain. Turn on the True Peak Limiter. Now play through the entire segment that you wish to measure and correct. During playback the textField value located on the WLM Plus Trim button will update in realtime, displaying the proper amount of gain compensation that is necessary to meet the Integrated Loudness target (it’s +2.1 dB in this example).

When measurement is complete, simply press the Trim button. This will set the Gain slider to the proper value for accurate compensation. Finish up by bouncing the segment through WLM Plus, much the same as any processing plugin. The processed audio will now match the Integrated Loudness Preset target and True Peaks will be limited accordingly.

I haven’t tested this in Pro Tools but my guess is this also works when using WLM Plus as an Audio Suite process on individual clips.

Of course you can make a manual adjustment to the Gain slider as well. In this case you would use the displayed Trim Value to properly set the necessary amount of gain compensation.

Great update to this well designed Loudness Meter.

-paul.

Loudness Meters: Absolute/Relative Scales …

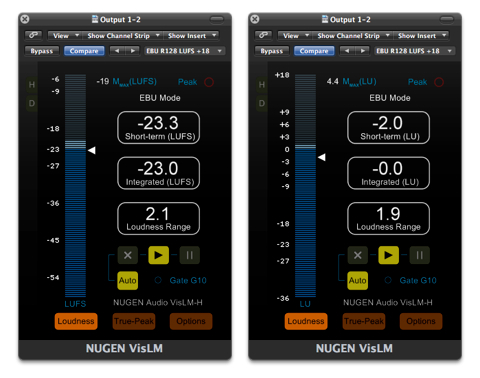
Professional audio Loudness Meters measure Program (Integrated) Loudness using an Absolute scale displayed in LUFS (or LKFS). For example the EBU R128 Program Loudness target is -23.0 LUFS (Loudness Units Relative to Full Scale).

When the ITU defined new audio loudness measurement guidelines, the general consensus was that many audio engineers would prefer to mix to the familiar “0” level on a Loudness Meter for compliance targeting. A Relative scale option was implemented. It references Loudness Units (LU), where 0 LU equals the corresponding LUFS/LKFS compliance target.

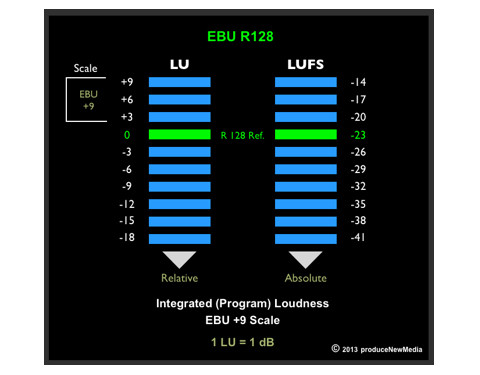
So for EBU R128 … 0 LU == -23.0 LUFS.

In the snapshot below you can see my Nugen VisLM Loudness Meter set to display Absolute scale (left) and Relative scale (right).

scale-blog

Of course in most cases the scales and corresponding targets are customizable. For example I advocate -16.0 LUFS as the loudness target for audio distributed on the internet. By defining -16.0 LUFS as my Absolute scale compliance target in a meter’s setup options, 0 LU (Relative scale) would be equivalent to -16.0 LUFS.

Below is a basic side by side comparison of EBU R128 Absolute and Relative scales:

figg-scale

-paul.